Customer Churn Prediction
Banking ML model predicting customer attrition with 86.93% accuracy, enabling proactive retention strategies worth millions.
Academic Project: ALY6015 - Intermediate Analytics | Northeastern University | Dr. Sohom Mandal | February 2025
Model Performance Analysis
Comprehensive evaluation using confusion matrices, feature importance analysis, and customer segmentation.
Random Forest Confusion Matrix
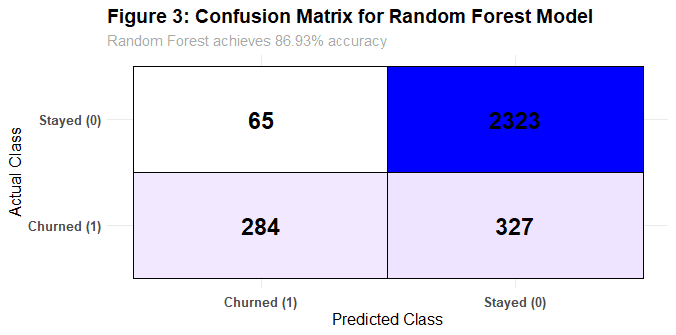
Random Forest achieved 86.93% accuracy with 46.48% sensitivity (2x better than Logistic Regression)
Feature Importance Rankings
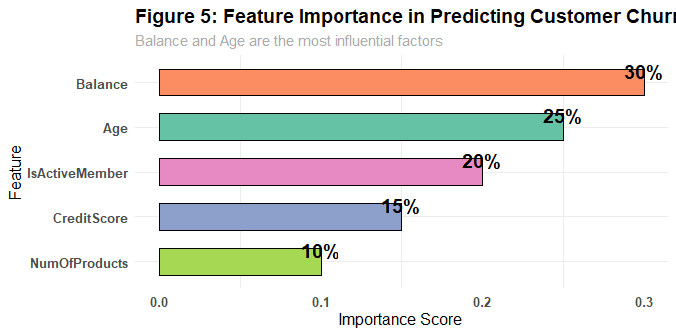
Balance (30%), Age (25%), and Active Membership (20%) were the strongest churn predictors
Customer Segmentation (K-Means)
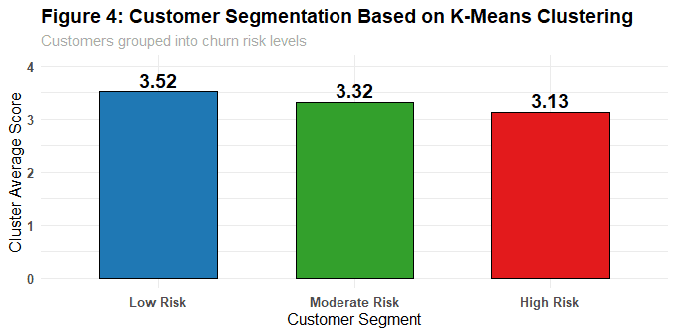
Customers segmented into Low-Risk (3.52), Moderate-Risk (3.32), and High-Risk (3.13) clusters
PCA Dimensionality Reduction
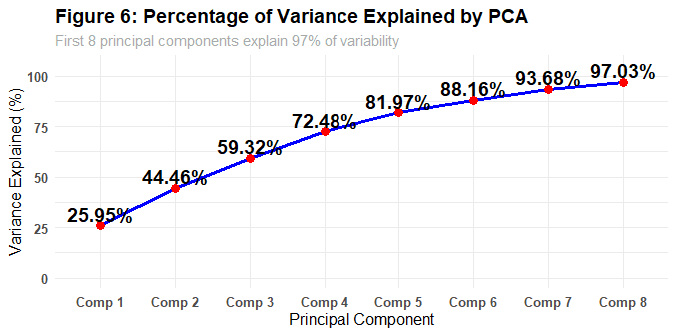
8 principal components retained 97% of variance, reducing dimensionality without information loss
1Problem
Customer churn directly impacts bank revenue and profitability. Acquiring new customers costs 5-7x more than retaining existing ones. Banks need predictive models to identify at-risk customers proactively.
2Solution
Built and compared three classification models on 10,000 customers. Applied advanced techniques including K-Means clustering for segmentation, PCA to reduce multicollinearity, and feature engineering to capture behavioral patterns.
- →Random Forest with 100 trees for robust predictions
- →K-Means clustering into Low/Moderate/High risk segments
- →10-fold cross-validation for reliability
3Impact
- ✓86.93% accuracy (Random Forest best model)
- ✓Improved sensitivity from 23% → 46.48% (2x improvement)
- ✓Segmented 10K customers into actionable risk groups
- ✓Identified Germany (45% churn) for targeted intervention
Model Performance Comparison
| Model | Accuracy | Sensitivity (Churn Detection) | Specificity (Retention Detection) |
|---|---|---|---|
| Logistic Regression | 82.06% | 23.08% | 97.15% |
| Decision Tree | 86.26% | 40.43% | 97.99% |
| Random Forest ✓ | 86.93% | 46.48% | 97.28% |
Why Random Forest Won: Balanced high accuracy with the best sensitivity (churn detection). Logistic Regression missed 77% of churners despite high overall accuracy—useless for retention campaigns.
Key Business Insights
Balance is the Strongest Predictor (30% importance)
Customers with lower account balances are significantly more likely to churn. This suggests that financial engagement correlates with retention—customers with minimal balances may not perceive value in maintaining the relationship.
Implement balance-building incentives: offer cashback rewards, savings challenges, or fee waivers for customers maintaining minimum balances.
Germany Requires Urgent Attention (45% churn rate)
Germany's churn rate is 3x higher than France (15%) and 2.25x higher than Spain (20%). This suggests region-specific issues—possibly competitive pressure, regulatory differences, or service quality gaps.
Deploy dedicated retention team in Germany. Conduct exit interviews to understand why customers leave. Consider localized products or pricing.
Inactive Members are High-Risk (20% importance)
Active membership status is the 3rd strongest predictor. Customers who aren't engaging with bank services (online banking, mobile app, transactions) are much more likely to churn.
Gamify engagement: send personalized nudges, offer rewards for using digital banking features, flag 90-day inactive customers for outreach.
Age Matters: Middle-Aged Customers Stay
Older customers (40-60) show lower churn rates. Younger customers (18-30) are more price-sensitive and willing to switch banks for better offers.
Age-specific retention strategies: loyalty perks for seniors, competitive rates/digital features for younger segments.
Technical Implementation
Random Forest Implementation with Feature Importance
Built Random Forest classifier with 100 trees, extracting feature importance scores to identify key churn drivers.
# Load required libraries
library(randomForest)
library(caret)

# Train Random Forest Model
set.seed(123)
rf_model <- randomForest(
  Exited ~ CreditScore + Geography + Gender + Age + Balance +
           NumOfProducts + IsActiveMember,
  data = train,
  importance = TRUE,
  ntree = 100
)

# Plot Feature Importance
varImpPlot(
  rf_model,
  main = "Feature Importance in Random Forest Model"
)

# Predictions on test data
rf_preds <- predict(rf_model, newdata = test)

# Evaluation
conf_matrix_rf <- confusionMatrix(rf_preds, test$Exited)
print(conf_matrix_rf)

# Results:
# Accuracy: 86.93%
# Sensitivity (Churn Detection): 46.48%
# Specificity (Retention Detection): 97.28%
K-Means Customer Segmentation
Applied K-Means clustering to segment 10,000 customers into Low, Moderate, and High-risk groups based on churn probability.
library(cluster)
library(factoextra)

# Normalize features for clustering
clustering_data <- scale(
  train[, c("CreditScore", "Age", "Balance",
            "NumOfProducts", "EstimatedSalary")]
)

# Determine optimal clusters using Elbow Method
set.seed(123)
wss <- sapply(1:10, function(k) {
  kmeans(clustering_data, centers = k, nstart = 25)$tot.withinss
})

# Apply K-Means with k=3
kmeans_model <- kmeans(clustering_data, centers = 3, nstart = 25)

# Visualize Clusters
fviz_cluster(
  kmeans_model,
  data = clustering_data,
  geom = "point",
  ellipse = TRUE,
  main = "Customer Segmentation by Churn Risk"
)

# Cluster Centers:
# Low-Risk: 3.52 (high balance, active, multiple products)
# Moderate-Risk: 3.32 (mid-range engagement)
# High-Risk: 3.13 (low balance, inactive, fewer products)
PCA for Dimensionality Reduction
Used Principal Component Analysis to reduce multicollinearity and improve model efficiency while retaining 97% of variance.
library(ggplot2)
library(factoextra)

# Standardize features
pca_data <- scale(
  train[, c("CreditScore", "Age", "Balance",
            "NumOfProducts", "EstimatedSalary")]
)

# Perform PCA
pca_model <- prcomp(pca_data, center = TRUE, scale. = TRUE)

# Scree Plot - Variance Explained
fviz_eig(
  pca_model,
  addlabels = TRUE,
  barfill = "steelblue",
  main = "Variance Explained by Principal Components"
)

# Results: First 8 components explain 97% of variance
# Comp 1: 25.95%
# Comp 2: 44.46% (cumulative)
# ...
# Comp 8: 97.03% (cumulative)

# This allowed us to reduce 14 features to 8 components
# without significant information loss
Lessons Learned
Accuracy Isn't Everything—Sensitivity Matters More: Logistic Regression had 82% accuracy but only caught 23% of churners. For business value, detecting at-risk customers (sensitivity) matters more than overall accuracy. Random Forest's 46.48% sensitivity meant we caught twice as many churners.
Class Imbalance Requires Strategic Handling: With only 20% churn rate, models naturally bias toward predicting "no churn." Used stratified sampling and evaluated precision-recall tradeoffs rather than just accuracy. Real-world deployment would require threshold tuning based on intervention costs.
Geographic Differences Demand Localized Strategies: Germany's 45% churn vs. France's 15% wasn't a data quirk—it revealed real market dynamics. One-size-fits-all retention won't work. Banks need country-specific playbooks.
Feature Engineering Beats Algorithm Selection: Initial models performed poorly. Adding engineered features (active_member_status, balance_bins, age_groups) improved all models. Good features matter more than fancy algorithms.
Actionable Recommendations for Banks
Immediate Actions (30 days)
- • Deploy model to score all active customers monthly
- • Create "High-Risk Customer" dashboard for retention team
- • Launch Germany-focused retention pilot program
- • Implement automated email campaigns for inactive members
Long-Term Strategy (6-12 months)
- • Integrate model predictions into CRM system
- • A/B test retention offers on High-Risk segment
- • Build real-time churn prediction API for branch staff
- • Expand model to include transaction-level behavioral data